
To reduce charge lag, measure the days between each date of service and the date the charge posts. Then fix the three places where charges stall: late chart closure, unclear documentation and manual handoffs to billing. Aim for complete charges within three to five days of the visit. Same-day chart closure is the ideal. Most practices get there by reporting lag by provider, setting a chart-closure rule, and catching coding and charge gaps before the claim leaves.
This guide covers how to calculate charge lag, what a good number looks like, the workflow changes that move it, and what the published evidence says about the payoff.
TL;DR
- Charge lag is the average number of days from date of service to charge posting. HFMA's KPI guidance puts best practice at complete charges within three to five days.
- Late charges should be no more than 2% of all charges, according to the same HFMA guidance.
- The biggest lever is chart closure. The AMA calls same-day closure ideal and three days acceptable.
- Report lag by provider. Outliers show you where to focus first.
- Automation helps most when it checks documentation and charges before the claim is submitted, not after a denial.
Table of Contents
- What charge lag is and why it costs you money
- How to measure charge lag
- Where charges get stuck
- Seven workflow changes that reduce charge lag
- What the evidence says about the payoff
- Perspective: fix the charge before it becomes a claim
- See what your charge gaps are worth
- A 30-day plan to bring lag down
- Common objections
- FAQ
- Sources
What charge lag is and why it costs you money
Charge lag is the time between the date a patient is seen and the date the charge is entered in your billing system. Nothing is billed until the charge exists. Every day it waits is a day the practice has not been paid for work already done.
That delay compounds. A later claim means later payment, and later payment means more days in accounts receivable. Practices feel it in payroll, overhead and the cash available for investment. In extreme cases, a charge sits so long that it runs into a payer's timely filing deadline and the revenue is lost for good.
Charge lag is also easy to miss. Delayed charges do not always create a denial or a visible error. Nobody gets an alert. The cost shows up as a slower A/R curve and a few encounters that never get billed at all.
It is not the same as claim-submission lag, although the two stack. A charge can post on day two and the claim can still sit in a scrub queue for a week. Track both, but start with charge lag. It is the first domino.

How to measure charge lag
HFMA defines charge lag time as the average number of days from date of service to posting date. Pull it from your practice management system for a recent period, then break it down.
Here is a simple illustration with made-up numbers. Say a three-provider practice posts 300 charges in a month:
| Provider | Charges | Average days to post |
|---|---|---|
| Provider A | 120 | 1.5 |
| Provider B | 100 | 3.0 |
| Provider C | 80 | 9.0 |
The practice-wide average is (120 × 1.5 + 100 × 3.0 + 80 × 9.0) ÷ 300, or 4.0 days. That looks acceptable. But the average hides Provider C, whose charges wait three times longer than the benchmark. This is why a single practice-wide number is not enough.
Benchmarks to compare against
| Measure | Benchmark | Source |
|---|---|---|
| Complete charges captured after date of service | 3 to 5 days | HFMA |
| Late charges as share of all charges | 2% or less | HFMA |
| Chart closure after the encounter | Same day ideal, within 3 days acceptable | AMA revenue cycle guide |
Track three views every month:
- Average lag by provider. This finds the outliers.
- Percentage of charges posted after your cutoff. This is your late-charge rate against the 2% mark.
- Encounters with no charge at all. These are the invisible losses, and a missing-encounter report is the only way to see them.
If you also want to size what the gaps cost, our guide to charge capture errors and revenue loss shows how to put a range on it.
Where charges get stuck
In independent practices, delays usually come from the same handful of places.
- Open charts. The visit happened, but the note is not signed. Billing cannot code what is not finished. The AMA describes prompt chart closure as a critical part of the revenue cycle for physicians in every practice setting.
- Incomplete or unclear notes. Coders who cannot read the documentation have to query the provider. MGMA advises that coders should not guess at illegible or incomplete notes, because guessing creates more work later. A query adds days.
- Missing front-end information. Authorization details, referral documentation, eligibility updates and coverage changes need to travel with the claim. When they do not reach billing, the charge waits.
- Paper or double-entry steps. Superbills, handwritten encounter forms and re-keying into a second system slow every charge and add errors.
- No visibility. The financial impact of delays is often not obvious to managers or physicians. Without a report, nobody owns the problem.
Our post on EHR documentation gaps goes deeper on the documentation side of this list.
Seven workflow changes that reduce charge lag
1. Set a chart-closure standard and publish it
Start with the rule. The AMA treats same-day closure as ideal and three days as acceptable. One academic medical center's policy, quoted in the AMA guide, requires notes to be completed concurrent with or immediately after the service. Office visits are due on the date of service and no later than two business days after it. Pick a standard that fits your schedule, write it down, and make it the same for every provider, owners included.
2. Report lag by provider and by clinic
A health system case study from HFMA shows the pattern. Practice managers, physicians, coders, revenue cycle leaders and IT staff worked together to build reporting that showed charge lag by clinic and by individual physician. The goal was to find outliers and decide where to focus. You do not need a committee in a small practice. You need a one-page report that goes to every provider each week.
3. Replace paper steps with an EHR workflow
The same HFMA case study describes replacing a paper process in one specialty clinic with an EHR workflow as part of its improvement work. If any of your charges still start on a paper form, that is the first step to retire. Charges should be generated from the encounter itself, not retyped from a sheet.
4. Close the handoff between clinical and billing staff
Give billing a clear way to flag a problem and give providers a clear way to answer it. The AMA notes that administrative staff play a key role in knowing insurance requirements and which documentation certain codes need. They also spot codes that may be missing by reading between the lines of the note. Make that expertise part of the process rather than a rescue step. Our overview of the role of HIM in revenue integrity explains how that function fits a physician practice.
5. Standardize documentation for your top codes
When a note lacks what a code requires, the charge either stalls or goes out wrong. Build short templates for your highest-volume services. For one example, see our 9-point documentation checklist for 99214.
6. Make signatures fast and compliant
Corrections and queries often wait on a physician's signature. A secure electronic signature step removes a common bottleneck, provided the controls are sound. We cover them in physician e-signature compliance.
7. Use automation where it removes waiting
The AMA guide notes that ambient AI scribe tools listen to patient encounters and draft clinical notes in the EHR. That supports more detailed documentation and better coding and billing downstream. It also notes that physicians must approve AI-drafted notes for accuracy. Treat automation as a way to speed the physician's review, not replace it.
What the evidence says about the payoff
The strongest published numbers come from two sources.
A cardiology clinic study. A peer-reviewed study of a large cardiology clinic, with about 18,000 visits a year and 43 providers, looked at a point-of-service computerized charge entry system. Lag between date of service and charge posting fell from 14.1 days to 9.8 days. Days in A/R and interest expense dropped. Missing encounters fell from 72 to 28, a 39% decrease. The authors also projected eliminating about five full-time equivalents of charge entry and missing-encounter retrieval work. The study is from 2003, so the technology is dated, but the mechanism is the same: capture the charge at the point of service and fewer encounters fall through.
A health system case study. HFMA's Benefis Health System case study, published in 2017, reports first-year results from several changes. They included charge-lag reporting by clinic and physician and an EHR workflow replacing paper in one clinic. Results included a $1.9 million annualized improvement in total cash posted (4.1%), gross A/R down 2.8 days and net A/R down 9.9 days. Those results reflect a bundle of changes at a health system, not charge lag alone, and your results will depend on your starting point.

The common thread is plain. Make the lag visible, assign ownership, and remove manual steps.
Perspective: fix the charge before it becomes a claim
We see charge lag as a symptom. The delay you can measure is the days between visit and posting. The cost behind it is everything that went wrong in those days: an unsigned note, a missing level of service, a procedure that never made it onto the charge.
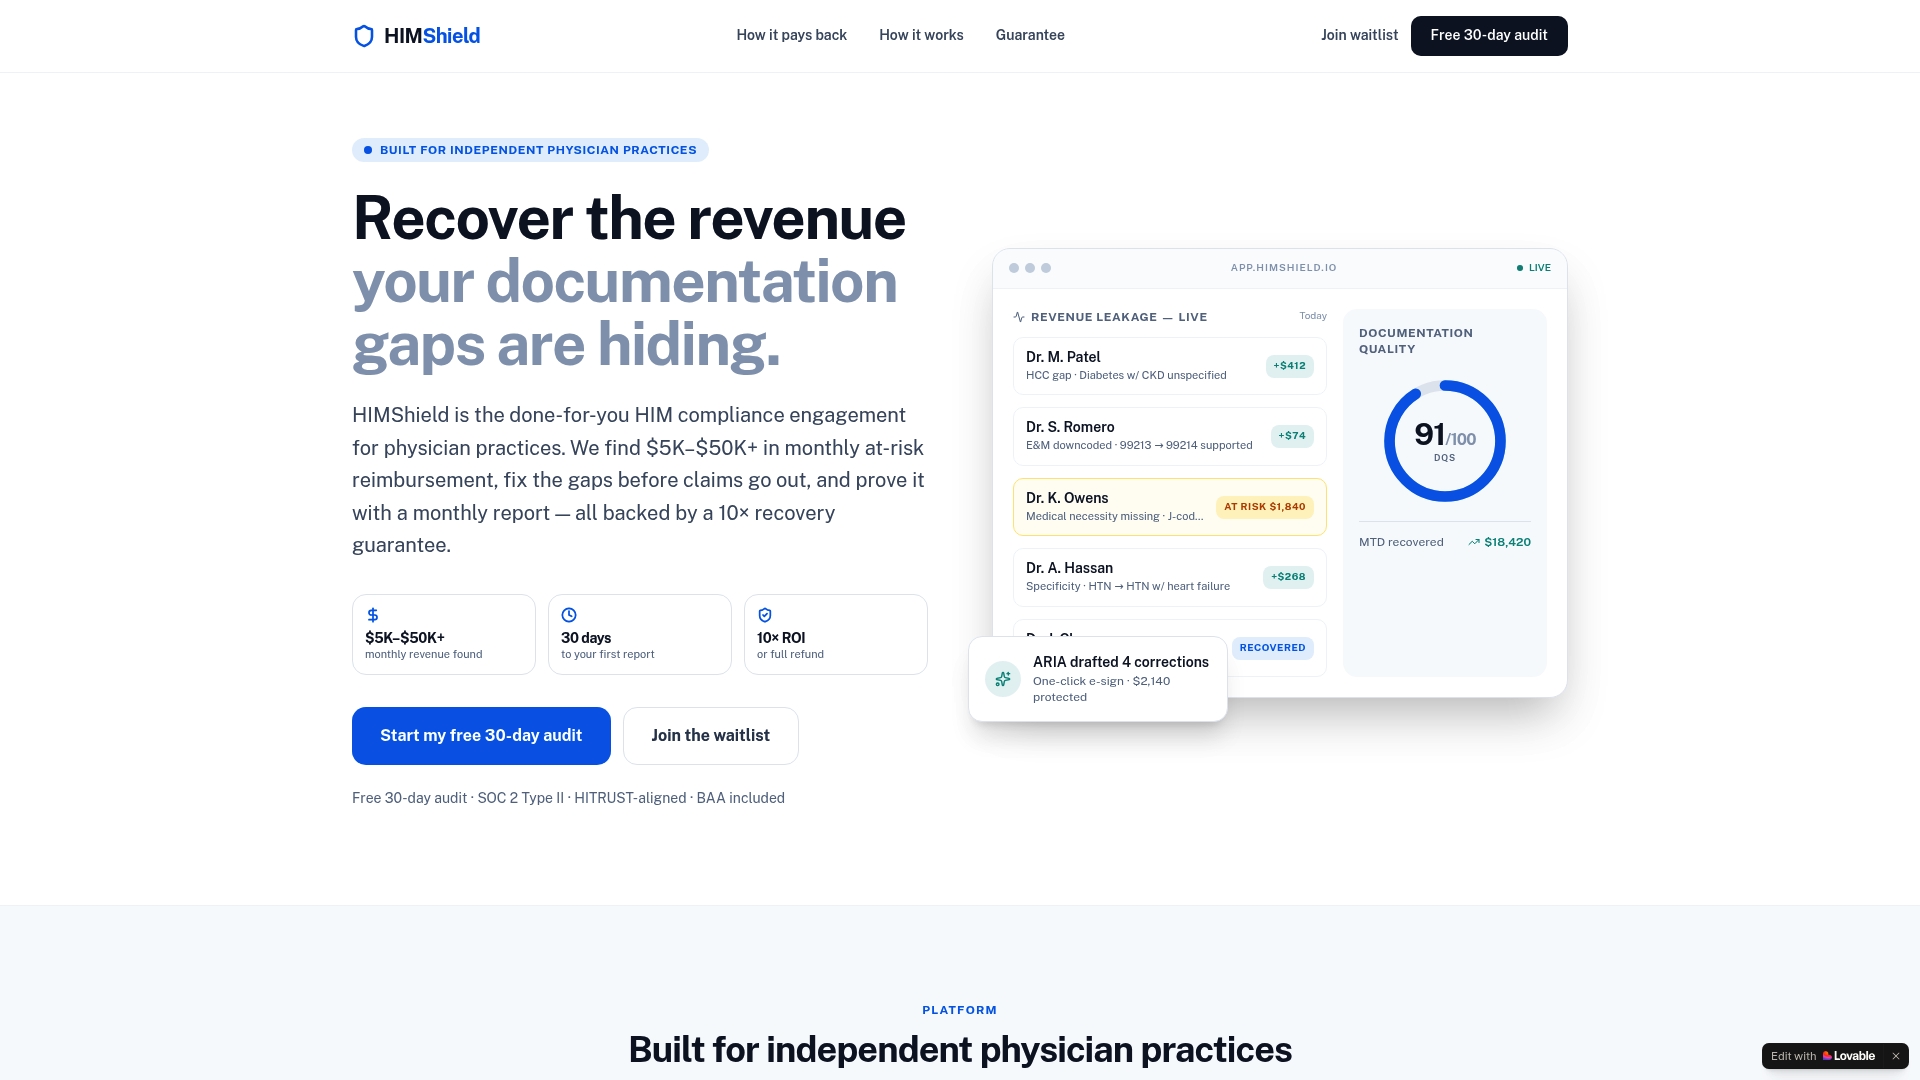
Most independent practices do not have a person whose job is to find those problems before the claim goes out. Billers fix what they see, and what they see is what was entered. A charge that was never captured does not look like an error. That is why we built HIMShield to scan EHR data for coding, documentation and charge-capture gaps before submission, and to quantify them per provider and per payer.
Our approach is built around the physician's time. We auto-draft corrections and route them for one-click e-signature, so a fix takes seconds instead of a week of back and forth. We score documentation quality in real time, so a thin note is flagged while the visit is still fresh. And we do it without asking your team to learn new software.
If you do one thing this month, put a number on it. Find out what your gaps are worth by provider. In our experience, once a practice sees the dollar figure, the workflow changes stop being optional.
Elena
See what your charge gaps are worth
Shortening lag helps cash flow. Finding the charges that never post helps revenue. If you want both numbers, we offer a free 30-day Revenue Leakage Audit. It scans your EHR data for coding, documentation and charge-capture gaps and delivers per-provider, per-payer Revenue Leakage Reports. The audit comes with our performance guarantee, and it works without new staff or software training for your team.
If you would rather talk through your workflow first, you can learn about our HIM compliance engagement for independent practices.
A 30-day plan to bring lag down
You can make real progress in a month without buying anything.
Week 1: Baseline.
- Pull date of service and posting date for the last full quarter.
- Calculate average lag overall and by provider.
- Calculate your late-charge rate and compare it with the 2% mark.
- Run a missing-encounter report: visits on the schedule with no charge.
Week 2: Set the rule.
- Choose a chart-closure standard, same day or within a set number of days.
- Share it with providers along with their own numbers.
- Agree on how billing flags an incomplete note and how fast the provider answers.
Week 3: Remove friction.
- Retire any paper charge sheet that is still in use.
- Build templates for your five most common visit types.
- Set up a daily list of unsigned notes for each provider.
Week 4: Review and repeat.
- Re-run the report.
- Talk with the outliers about what is blocking them. It is usually schedule design or note length, not willingness.
- Decide what you will measure monthly from now on.
When you find charges that were coded wrong rather than late, our four-step coding correction process shows how to fix them cleanly.
Common objections
"My providers are too busy to close charts the same day." That is often true on heavy days, which is why a standard of up to three days is acceptable under the AMA's framing. The point is to stop notes from drifting beyond that. Templates and scribe tools shorten the work.
"Our average looks fine." Look at the spread. One provider at nine days can sit behind a practice-wide average of four.
"We would have to change systems." Not necessarily. Reporting, closure rules and handoff fixes work inside your current EHR and billing setup. Automation that reads your existing EHR data adds visibility without replacing either one.
FAQ
What is a good charge lag for a physician practice?
HFMA's KPI guidance says best practice is to capture all complete charges within three to five days of the date of service. It also suggests keeping late charges to 2% or less of all charges. Many practices aim for faster, with same-day chart closure as the ideal the AMA describes.
How do you calculate charge lag?
Subtract the date of service from the charge posting date for each encounter, then average the results. HFMA defines it as the average number of days from date of service to posting date. Run it by provider and by payer too, because an overall average can hide a few slow providers.
Does charge lag cause denials?
Not always, and that is why it is easy to miss. A delay does not necessarily produce an error. It does push back claim submission and payment, and it raises days in A/R. If the delay runs past a payer's timely filing limit, the claim can be denied or the revenue lost.
Can AI reduce charge lag?
It can help. The AMA notes that ambient AI scribes draft notes in the EHR, which supports better documentation and downstream coding and billing. The physician still has to review and approve what the tool drafts. Tools that check documentation and charges before submission address the delay and the errors together.
Where should a small practice start?
Start with a baseline report of lag by provider, then set a chart-closure rule. Those two steps cost nothing and show you who and what is causing delays. From there, tackle paper steps and handoffs.
Sources
- A physician's guide to effective revenue cycle management, American Medical Association
- 7 KPIs providers should be tracking, HFMA
- Case Study: Physician Revenue Cycle Improvements, HFMA
- Return on Investment of Point of Service Computerized Provider Charge Entry, PubMed Central