
A per-payer risk analysis shows, payer by payer, where your practice is most likely to lose earned revenue to denials, coding and documentation gaps, missed charges and audits. It is not the same as risk adjustment, which is a payment formula. It is a review of your own claims data, split by payer and by provider, so you know which problems to fix first. HIMShield builds this view for independent practices: our free 30-day Revenue Leakage Audit produces per-provider, per-payer findings from your EHR data.
TL;DR
- Per-payer risk analysis compares denials, coding patterns, documentation quality and charge capture across each payer you bill. It is a compliance and cash-flow tool, not a risk score for patients.
- HHS OIG's guidance for small physician practices tells you to review denial history and run baseline and periodic self-audits. A per-payer view is the practical way to do both.
- A provider risk profile report adds the second cut: which clinicians drive the exposure with which payers.
- Rank findings by dollars at risk and likelihood of audit, then fix the top few before claims go out, not after they come back.
- Practices that do not have staff time for this can have it done for them.
Table of Contents
- What per-payer risk analysis means for your practice
- What to measure for each payer
- How to run a per-payer risk analysis, step by step
- The provider risk profile: the second cut of the data
- Reading the results without overreacting
- Why this pays off for an independent practice
- Get your per-payer picture in 30 days
- Our perspective
- FAQ
- Sources
What per-payer risk analysis means for your practice
Every payer you bill applies its own edits, medical policies, documentation expectations and audit priorities. A claim that sails through one plan gets denied by another. If you only look at your practice-wide denial rate, those differences cancel out and the problem hides.
A per-payer risk analysis separates the data by payer and asks four questions for each:
- How often do claims get denied or paid in part, and why?
- Which codes and documentation patterns create exposure if that payer audits us?
- Are we capturing every billable service, or leaving money on the table?
- Are we being paid what the contract says?
The answers give you a ranked list. The payer with the most dollars at risk and the clearest pattern goes to the top.
The federal government treats this kind of review as a basic good practice. The HHS Office of Inspector General's Compliance Program Guidance for Individual and Small Group Physician Practices tells practices to look at their claims denial history and find the most frequent sources of denials. It describes the payoff as improved cash flow, because claims submitted correctly are paid the first time.
How it differs from risk adjustment
The search term sits close to "risk adjustment," and the two get confused. Risk adjustment modifies payments to providers based on patient characteristics such as age, sex, chronic conditions and disabilities, using statistical models and risk scores applied to a baseline payment, as the Commonwealth Fund explains. In Medicare Advantage and many value-based contracts, that process runs on Hierarchical Condition Category (HCC) codes. CMS introduced the HCC model in 2004, and each HCC maps to ICD-10-CM diagnosis codes that insurers combine with demographic factors into a RAF score, according to the AAFP's HCC primer.
The two overlap in one place. If your documentation does not capture patient complexity, risk scores understate it. The AAFP warns that in value-based models this can make patients look costlier or lower quality than expected, which can push a practice below quality and cost targets and cost it shared savings. So HCC documentation gaps belong in your per-payer analysis for any payer that pays on risk scores. But the analysis itself is broader: it covers every payer and every claim type, including plain fee-for-service.

What to measure for each payer
You do not need hundreds of metrics. You need a consistent short list, run the same way for each payer, so the differences are visible.
Denial and payment metrics
The Healthcare Financial Management Association's MAP Keys, a standard set of revenue-cycle measures, give you a ready list. The physician-practice measures include initial denial rate, denial write-offs as a percent of net revenue, professional services denial percentage, and aged A/R by payer group. Calculate each one by payer, not just for the practice as a whole.
Two points matter when you read them:
- Initial denial rate tells you how often a payer rejects or short-pays the first submission. A high rate usually points to a fixable front-end cause.
- Aged A/R by payer shows which payer is slow, even when denials look normal.
For a deeper look at why denial rates vary by payer, see our piece on payer-specific denials.
Coding and documentation metrics
This is where audit exposure lives. Look at, for each payer:
- E/M level distribution. The share of visits billed at each level, compared with what peers bill.
- Modifier use. Patterns such as frequent modifier 25 or 59 draw attention.
- Diagnosis specificity and HCC capture. Are chronic conditions documented and coded each year when they are addressed?
- Documentation completeness. Does the note support the level billed: history, exam and medical decision making?
ACEP's Reimbursement Committee notes that payer audits are often triggered by reports that flag providers as outliers against peers in the same contractor region. Its example is emergency E/M codes, but the logic holds for any specialty: a clinician whose code distribution sits far from the average profile can be targeted for a focused audit. If you compare yourself to peers before the payer does, you see the outlier first.
Charge capture and underpayment
Risk is not only overbilling. Underbilling is a loss with no audit attached. Compare services documented in the chart with services billed, by payer and by provider. Then compare what each payer paid against your contracted rate for the most common codes. Gaps in either direction are revenue leakage. Our guide on why practices lose reimbursement walks through the common causes.
How to run a per-payer risk analysis, step by step
Step 1: Pull twelve months of claims and remittance data
Export claims, remittance advice (ERA) data and denial reason codes from your practice management system, plus the matching chart documentation from your EHR. Twelve months smooths out seasonality and gives each payer enough volume to show a pattern. Where it goes wrong: data lives in two or three systems with different payer names for the same plan. Normalize payer names first or your numbers will split.
This is the step HIMShield takes off your hands: the platform reads EHR data to identify and quantify coding, documentation and charge-capture gaps, with no new staff or software training required.
Step 2: Group payers sensibly
Start with your top payers by revenue, usually the ones that make up about 80 percent of collections, then bundle the long tail by type (commercial, Medicare Advantage, Medicaid managed care). Separate Medicare fee-for-service from Medicare Advantage, because their rules and audit programs differ.
Step 3: Calculate the baseline metrics for each payer
Run the denial, coding and charge-capture measures above for each group. OIG recommends that practices run baseline and periodic self-audits to determine whether bills are accurately coded, documentation is complete, and services are reasonable and necessary. This step is your baseline. Put the results in one table with payers in rows and metrics in columns so differences stand out.
| Payer group | Initial denial rate | Top denial reason | E/M outlier vs. peers | Dollars at risk |
|---|---|---|---|---|
| Payer A | Your data | Your data | Your data | Your data |
| Payer B | Your data | Your data | Your data | Your data |
| Payer C | Your data | Your data | Your data | Your data |
Step 4: Find the cause behind each pattern
A denial rate tells you where to look, not what to fix. Sort denials by reason code and by the clinician and code involved. Typical causes include missing authorization, a diagnosis that does not support medical necessity under that payer's policy, bundling edits, and notes that do not support the level billed. The same cause often shows up at several payers, but one payer's policy usually makes it worse.
Step 5: Rank by dollars and by audit likelihood
Score each finding on two scales: how many dollars it puts at risk, and how likely it is to draw attention. CMS uses the same ranking logic on its side. A 2026 revision of the CMS Medicare Contractor manual directs Medicare contractors to analyze Recovery Auditor data to identify the providers and services with the highest improper payment rates and the greatest improper payment dollars. Rank your own list the same way: high rate, high dollars, first.

Step 6: Fix upstream, then monitor
Correct the process before the claim is submitted: templates, front-desk checks, coding edits, provider education. Then re-run the analysis quarterly, as OIG's guidance on periodic audits suggests. For a fuller view of denial prevention timelines, see our denial prevention strategy.
The provider risk profile: the second cut of the data
Once you see the risk by payer, split it by clinician. A provider risk profile report shows, for each physician or advanced practice provider, the same measures: code distribution, documentation quality, denial rate, missed charges and the payers where each pattern appears.
A good profile answers three practical questions:
- Who is the outlier, and with which payer? One clinician billing high-level E/M visits to a single commercial plan is a different problem from a practice-wide habit.
- Is the gap about coding or about documentation? If the note supports the level, the fix is a coding or charge-entry change. If it does not, the fix is documentation.
- What can be corrected now? Open claims and recent encounters can often be amended with a physician's signature before they become a recoupment issue.
This is the same view payers build about you. The HFMA's coding compliance presentation describes the usual carrier audit path: claims pay with limited front-end edits, a preliminary round requests random records and compares them with codes billed, and consistent mismatches lead to broader review and possibly prepayment review. A profile that shows you the mismatch first gives you time to correct it on your terms.
A note on tone: treat profiles as a coaching tool. Clinicians respond to specific, chart-level examples with a clear fix, not to rankings.
Reading the results without overreacting
A few rules keep the analysis honest:
- Small samples mislead. A payer with 40 claims can show a 25 percent denial rate from a single bad week. Weight your attention toward volume.
- Case mix is real. A provider with sicker patients may legitimately bill higher levels. Check that the documentation supports it before calling it an outlier.
- Complete data is the premise. The Commonwealth Fund notes that risk adjustment assumes complete, accurate and consistent data, and that coding practices can vary across plans. The same holds for your analysis: clean the inputs first.
- Anything can be reviewed in an audit. ACEP's committee points out that regardless of the stated focus, any part of a record can come under scrutiny. The strongest protection is thorough, accurate documentation of history, exam and medical decision making for every patient, since it supports correct coding and the defense of the level billed.
For the audit side, our guides on risk-based audits and why practices face OIG audits explain what draws attention, and the annual coding review guide covers how to schedule the work.
Why this pays off for an independent practice
Large systems have compliance departments and analysts for this. An independent practice usually has an administrator, a biller or two, and a physician who would rather see patients. The analysis is not hard to understand, but it is slow to do by hand: data from several systems, payer-by-payer slicing, chart-level review, then follow-through.
The cost of skipping it is not abstract. Denials you never trace repeat. Documentation gaps you never see turn into audit findings. Services you never capture never get paid. OIG's guidance frames the review of payer denials as both a compliance step and a cash-flow step, and that is the right way to think about the work. Our post on the OIG's 70 percent coding gaps finding and our overview of compliance program benefits go further on the business case.
Get your per-payer picture in 30 days
HIMShield's Free 30-day Revenue Leakage Audit scans your EHR data for coding, documentation and charge-capture gaps before claims are submitted, and delivers per-provider, per-payer Revenue Leakage Reports that quantify what is at risk. Our platform also sends automated compliance alerts, drafts corrections with one-click physician e-signature, scores documentation quality in real time and assembles submission-ready responses when a payer audits. We built it to work without new staff or software training, and our audit comes with a performance guarantee.
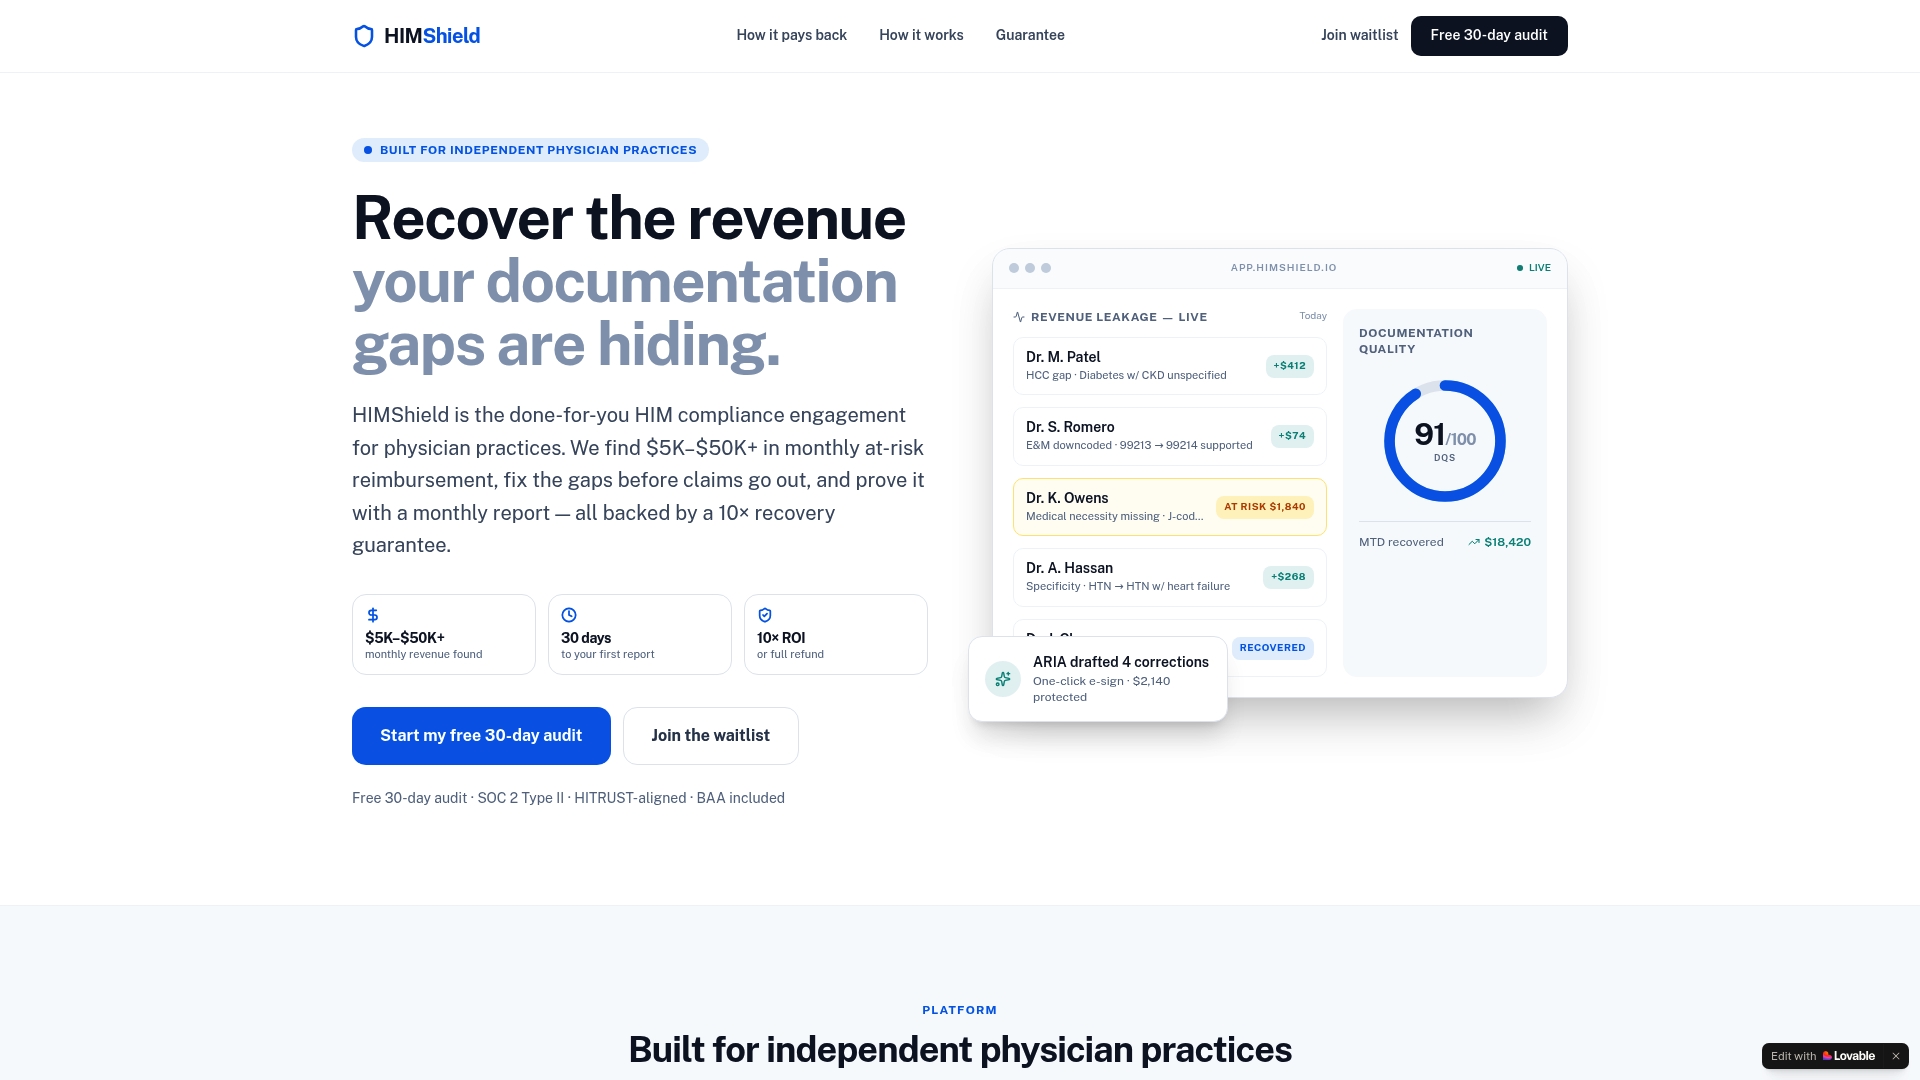
See what your payers are really costing you: start your free 30-day Revenue Leakage Audit, or learn more about our HIM compliance engagement.
Our perspective
Most practices we talk to know their overall denial rate. Few know their denial rate for each payer, and fewer still know which provider and which code sits behind it. That gap is where revenue leaks.
We designed HIMShield to close it. Our platform reads your EHR data, finds the coding, documentation and charge-capture gaps, and puts a dollar figure on them by provider and by payer. Then it drafts the correction and routes it to the physician for a one-click e-signature, so the fix takes seconds, not a chart-by-chart project.
We think independent practices should not need a compliance department to get this level of visibility. That is why our audit is free for 30 days, why it does not require new staff or software training, and why we stand behind it with a performance guarantee of 10× revenue recovery. When a payer does audit, the same data lets us assemble a submission-ready response quickly.
A per-payer risk analysis is only useful if someone acts on it. We make sure the findings arrive ready to act on.
Elena
FAQ
What is a per-payer risk analysis?
It is a review of your claims, coding and documentation data split by payer, so you can see which payers create the most denials, underpayments and audit exposure. It ranks the findings by dollars at risk. HHS OIG's guidance for small physician practices supports the core of it: review denial history and fix the most frequent sources.
Is per-payer risk analysis the same as risk adjustment?
No. Risk adjustment is a payment method that adjusts payments using patient characteristics and risk scores such as RAF. A per-payer risk analysis looks at your own billing and documentation risk. The two connect when incomplete HCC documentation lowers risk scores under a value-based or Medicare Advantage contract.
What does a provider risk profile report show?
It shows the same measures as the payer view, broken out by clinician: code distribution, documentation quality, denial patterns and missed charges, along with the payers where each appears. It helps you find outliers, decide whether the fix is coding or documentation, and target education.
How often should we run it?
Run a full baseline once, then repeat it on a regular schedule. OIG's guidance recommends baseline and periodic audits. Many practices review payer metrics quarterly and do a deeper coding review every year. Monthly monitoring of the top payers catches new denial patterns early.
Can a small practice do this without a compliance team?
Yes. HIMShield's free 30-day audit scans your EHR data and delivers per-provider, per-payer Revenue Leakage Reports without requiring new staff or software training from your team.
Sources
- Commonwealth Fund: Basics of risk adjustment
- AAFP: HCC coding for family physicians
- HHS OIG: Compliance Program Guidance for Individual and Small Group Physician Practices
- HFMA MAP Keys
- ACEP Reimbursement Committee: Preparing for payer audits
- HFMA: Coding compliance and risk mitigation
- CMS Medicare Contractor manual