
Payer mix is defined as the percentage distribution of a practice's revenue across commercial insurance, Medicare, Medicaid, and self-pay patients. Understanding why payer mix affects practice revenue is the single most important financial concept for independent physician practices in 2026. A 10-point shift from commercial to Medicaid coverage on the same patient volume reduces effective revenue by 8–15%. That figure alone explains why finance teams at independent practices must treat payer mix as a core revenue lever, not a background billing detail.
Why payer mix affects practice revenue: the reimbursement rate gap
The reimbursement rate gap between payer types is the root cause of payer mix's financial power. Commercial insurers pay the highest rates. Medicare pays roughly 80% of commercial rates. Medicaid pays 50–70% of Medicare rates. That cascade means a Medicaid patient generates less than half the revenue of a commercially insured patient for the exact same clinical encounter.
The scale of that difference becomes concrete when you look at daily visit data. A practice running 100 daily visits at Medicare rates generates $12,500 per day. The same 100 visits billed at commercial rates generate $28,800. That gap compounds to roughly $4.1 million annually. No operational efficiency gain closes a gap that size without addressing the underlying payer composition.

Administrative costs add a second layer of financial drag. Prior authorizations, claim denials, and appeals consume staff time and billing resources. A payer that reimburses at a higher nominal rate but requires triple the administrative workload may be less profitable than a lower-rate payer with clean claims. Net revenue per encounter, not gross reimbursement, is the number that matters.
| Payer type | Relative reimbursement | Administrative burden |
|---|---|---|
| Commercial insurance | Highest (baseline) | Moderate to high |
| Medicare | ~80% of commercial | Moderate |
| Medicaid | 50–70% of Medicare | High |
| Self-pay | Lowest (variable) | Low to moderate |
Pro Tip: Calculate net revenue per encounter by payer type quarterly. Subtract estimated administrative cost per claim from gross reimbursement before comparing payer profitability. The result often changes which payers you prioritize.
How payer mix shifts affect practice valuation and EBITDA
Payer mix does not just affect monthly cash flow. It directly determines what your practice is worth to a buyer or partner. Practices managing payer mix with more than 60% commercial insurance report 10–20% reimbursement improvement and earn valuation multiples of 7–9x EBITDA. Medicaid-heavy practices typically receive 4–5x EBITDA multiples. That difference can represent millions of dollars in enterprise value.
Physician compensation follows the same pattern. Physician groups need more than 50% of their patient panel covered by commercial insurance to maintain healthy physician compensation levels. Practices that slip below that threshold face compensation pressure that drives physician turnover, which then further degrades the commercial patient base.
Payer concentration risk compounds the valuation problem. Relying heavily on a single commercial payer creates exposure to that payer's denial rates and underpayments. When that payer tightens authorization rules or cuts rates, the practice has no buffer. Diversification across multiple commercial payers reduces that risk.
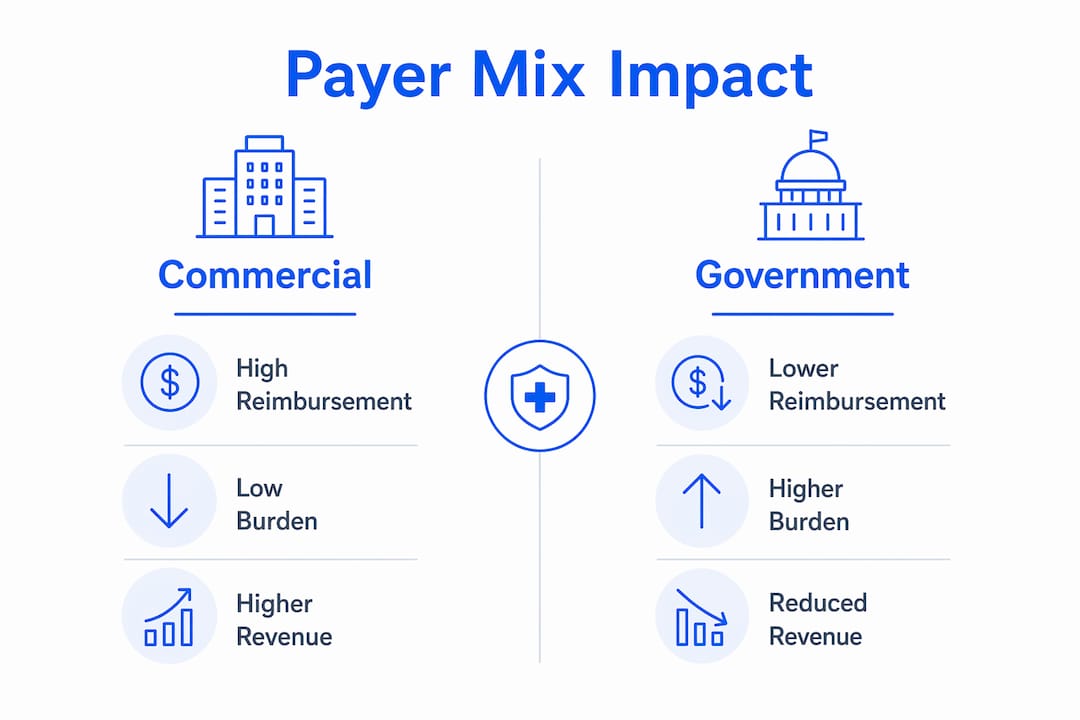
| Payer mix composition | Revenue impact | Valuation multiple |
|---|---|---|
| Greater than 60% commercial | 10–20% reimbursement improvement | 7–9x EBITDA |
| 50–60% commercial | Stable compensation threshold | Moderate multiple |
| Medicaid-heavy (below 40% commercial) | Revenue pressure, lower margins | 4–5x EBITDA |
Pro Tip: Set a monthly alert for any 5-point shift in your commercial payer percentage. A 5-point payer mix shift is the key warning sign that triggers an immediate revenue investigation before the erosion becomes structural.
Why volume growth alone does not protect your revenue
Patient volume is a misleading metric when payer mix is deteriorating. Flat volume masks revenue loss if the composition of that volume shifts toward lower-paying payers. A practice that sees 1,000 visits per month in january and 1,000 visits in june looks stable on a volume dashboard. If the june mix includes 200 more Medicaid patients and 200 fewer commercial patients, revenue has dropped materially with no change in the visit count.
This dynamic plays out in physician group studies repeatedly. A primary care group adds a new clinic location in an underserved area. Visit volume grows 15%. Revenue grows 3%. The explanation is always the same: the new location draws a higher proportion of Medicaid and self-pay patients. The volume metric celebrated the growth. The revenue metric told the real story.
The healthcare industry is experiencing a structural shift toward government and uninsured patients, creating sustained revenue pressure that volume growth cannot offset. This is not a temporary cycle. Practices that respond by chasing volume without managing payer composition will see margins compress year over year.
Finance teams at independent practices should track these metrics alongside visit volume:
- Net collection rate by payer: Measures actual dollars collected versus expected reimbursement per payer contract.
- Denial rate by payer: Identifies which payers generate the most rework and administrative cost.
- Revenue-weighted payer mix: Weights each payer's contribution by actual dollars collected, not just visit count.
- Days in accounts receivable by payer: Reveals which payers slow cash flow through delayed processing or frequent appeals.
What are the best strategies for managing payer mix in physician practices?
Active payer mix management starts with your insurance panel decisions. Accepting every payer contract that arrives is a common mistake. Signing contracts indiscriminately with many payers can reduce overall profit by introducing low-paying panels and increased administrative workload. Every new panel contract should be evaluated on net revenue per encounter, not gross reimbursement rate.
Attracting commercially insured patients requires deliberate outreach. Practices that invest in employer direct contracting, concierge service tiers, or targeted marketing to working-age demographics consistently improve their commercial payer percentage. These are not passive outcomes. They result from intentional business development decisions made by practice leadership.
Coding accuracy and documentation quality directly affect reimbursement from every payer type. Aligning HIM and physician workflows reduces undercoding, missed diagnoses, and charge capture errors that leave revenue on the table regardless of payer mix. A well-documented encounter recovers more from every payer category. Practices that invest in clinical documentation improvement through CDI best practices see measurable reimbursement gains across all payer types.
The most effective payer mix strategies for independent practices include:
- Monthly payer mix reporting: Track commercial, Medicare, Medicaid, and self-pay percentages by revenue dollars, not visit count.
- Contract renegotiation cycles: Review payer contracts annually and renegotiate rates that have not kept pace with cost increases.
- Panel closure decisions: Close panels to low-margin payers when administrative burden exceeds net revenue contribution.
- Denial pattern analysis: Identify payers with chronic denial patterns and factor that cost into profitability calculations.
- Technology-assisted risk detection: Use platforms that flag coding and documentation gaps before claims are submitted, reducing denial rates across all payers.
Pro Tip: Run a payer profitability analysis before renewing any contract. Calculate total administrative hours spent per payer per month, assign a cost to that time, and subtract it from gross collections. You may find that your second-highest-volume payer is your least profitable.
Key takeaways
Payer mix is the single most powerful revenue variable in an independent physician practice, and managing it actively is the difference between a practice that grows and one that quietly loses ground.
| Point | Details |
|---|---|
| Reimbursement gap is large | Medicaid pays 50–70% of Medicare rates; commercial pays the highest, creating a major per-encounter revenue difference. |
| Volume metrics mislead | Flat or growing visit counts can hide significant revenue loss when payer mix shifts toward lower-paying categories. |
| Valuation depends on mix | Practices above 60% commercial earn 7–9x EBITDA multiples; Medicaid-heavy practices earn 4–5x. |
| Monitor 5-point shifts | A 5-point drop in commercial payer percentage is the trigger for immediate revenue investigation. |
| Admin costs change the math | A higher-rate payer with heavy denial and authorization burden may generate less net revenue than a lower-rate clean payer. |
The metric most practices are not watching closely enough
I have worked with enough independent physician practices to know that payer mix analysis is almost always treated as a quarterly finance report item, not a live operational signal. That gap is where revenue quietly disappears.
The practices I have seen struggle most are not the ones with bad billing teams. They are the ones where leadership celebrates volume growth without asking what kind of volume it is. A busy schedule feels like success. But when the payer composition of that schedule has shifted 10 points toward Medicaid over 18 months, the practice is working harder for significantly less money.
What actually works is treating payer mix the way a good CFO treats cash flow: as a weekly or monthly signal that demands a response when it moves. The practices that do this catch problems early. They renegotiate contracts before rates become untenable. They make panel decisions based on data, not relationship inertia.
Technology matters here, but only if it surfaces the right information quickly. Platforms that connect to your EHR and flag revenue risk at the claim level give finance teams the early warning they need. The goal is not a perfect payer mix. The goal is a payer mix you understand and actively manage.
— Elena
How Himshield helps practices protect revenue from payer mix risk
Independent physician practices lose revenue at the claim level every day, often without knowing it. Coding gaps, documentation errors, and charge capture misses reduce reimbursement from every payer type, and the problem compounds when payer mix is already under pressure.
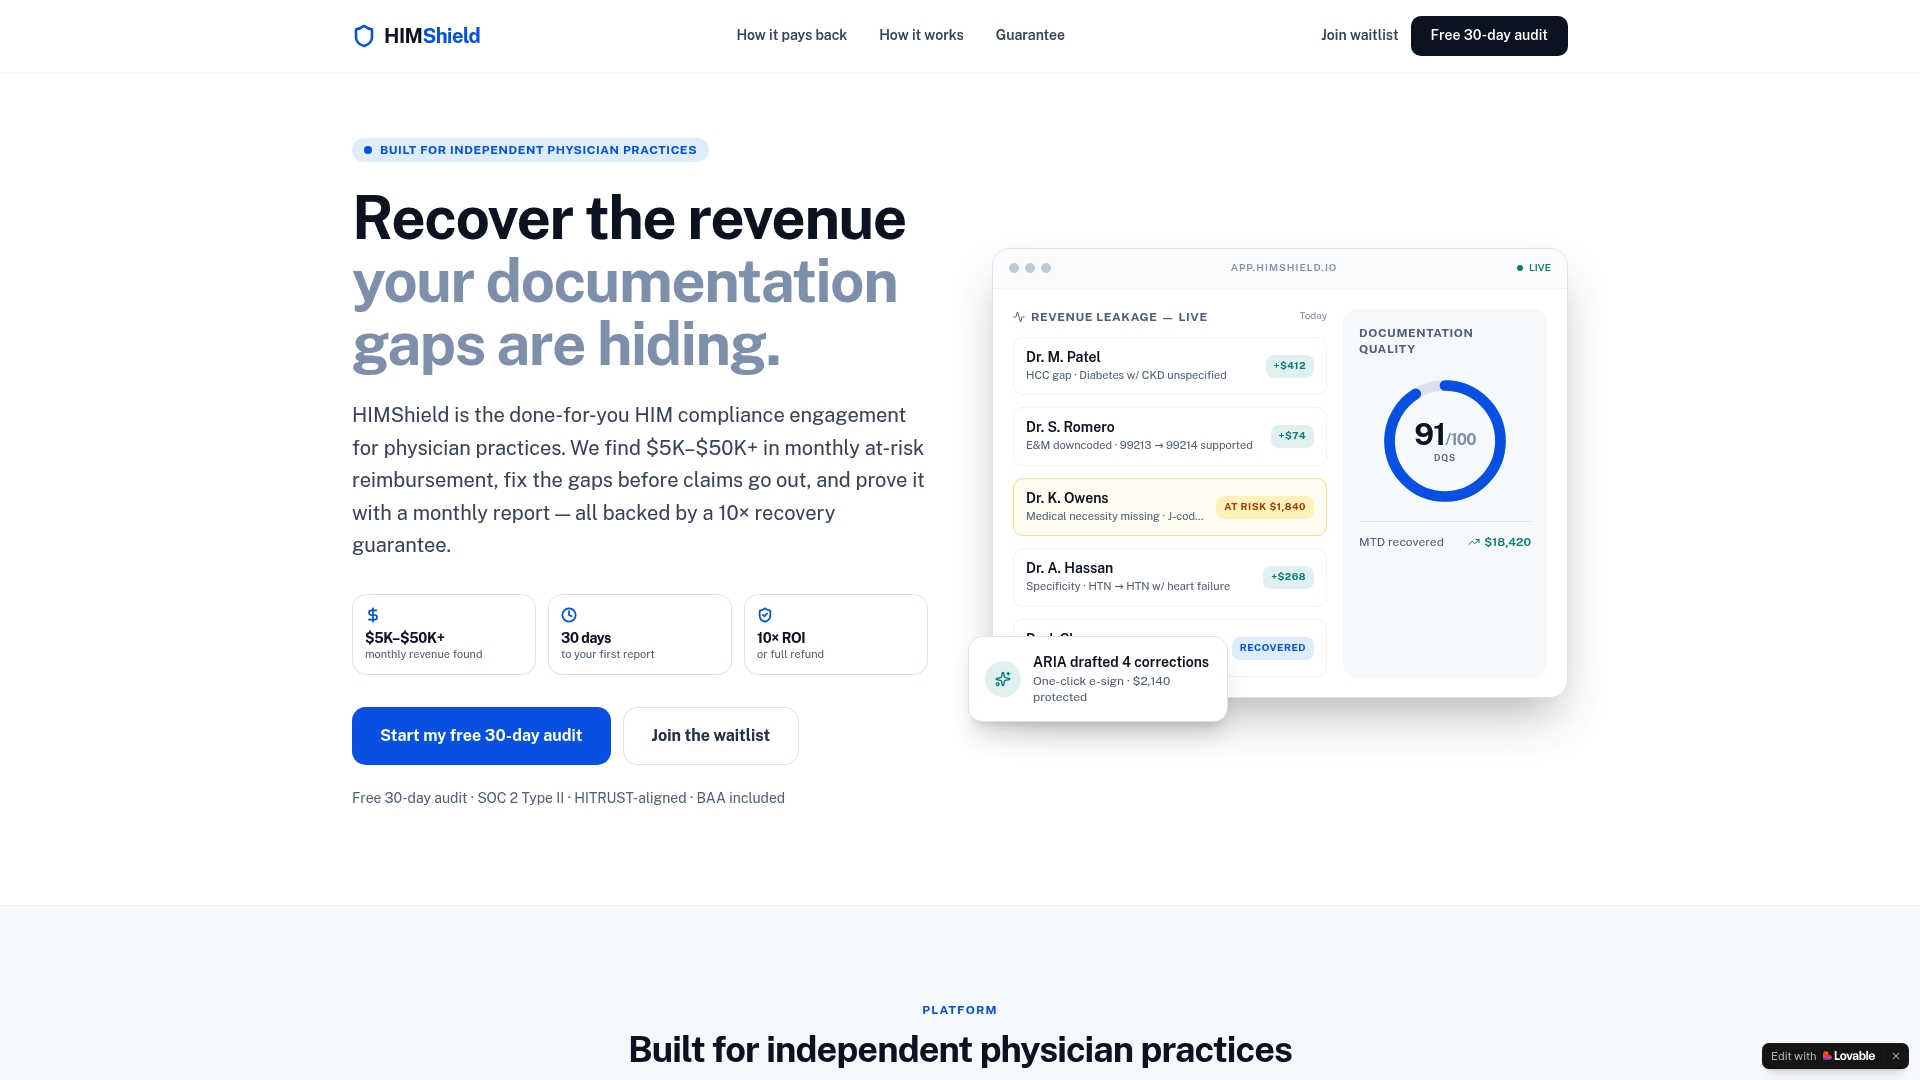
Himshield connects directly to your EHR and scans for coding, documentation, and charge capture risks before they become denials or audits. The platform gives finance teams clear, fast visibility into where revenue is at risk and why. Practices using Himshield have recovered $5K–$50K+ in hidden revenue within the first 30 days. Start with a free 30-day revenue leakage report to see exactly where your practice stands.
FAQ
What is payer mix in a medical practice?
Payer mix is the percentage breakdown of a practice's revenue by payer type, including commercial insurance, Medicare, Medicaid, and self-pay patients. It directly determines average reimbursement per encounter and overall practice revenue.
How does payer mix affect physician compensation?
Physician groups need more than 50% of their panel covered by commercial insurance to sustain healthy physician compensation levels. Practices with Medicaid-heavy panels face lower margins that compress physician pay over time.
What is a dangerous payer mix shift to watch for?
A 5-point drop in commercial payer percentage is the key warning signal for revenue erosion. Finance teams should investigate immediately when that threshold is crossed, as the revenue impact compounds quickly.
Can a practice have too many payer contracts?
Yes. Adding payer panels indiscriminately increases administrative burden and can reduce net profitability even when gross volume grows. Every contract should be evaluated on net revenue per encounter after accounting for denial rates and authorization workload.
How does payer mix affect practice valuation?
Practices with more than 60% commercial payer mix earn valuation multiples of 7–9x EBITDA. Medicaid-heavy practices typically receive 4–5x EBITDA multiples, representing a significant difference in enterprise value at the time of sale or partnership.