
Provider revenue analytics converts your EHR, claims, and remittance data into per-provider, per-payer signals that expose exactly where revenue is leaking and why claims get denied. The business outcome is concrete: practices that adopt it typically improve net collection rate, cut denial rate, and recover reimbursement they've already earned. Tools like HIMShield build this into a workflow independent practices can actually run.
TL;DR:
- Provider revenue analytics requires comprehensive data from the EHR, practice management, claims, remittance, and denial logs to accurately attribute denials and revenue leaks.
- Key metrics to track include net collection rate, accounts receivable days, denial rate, and coding variance, which directly inform targeted optimization actions.
- The most impactful initial focus should be on charge accuracy and provider coding performance, offering quick financial wins and buy-in from staff.
- Dashboards that visualize denial flows, payer lag, provider outliers, and recovery trends drive day-to-day decisions more effectively than extraneous data.
- Platforms like HIMShield enable small practices to identify and recover revenue within 30 days without developing internal analytics infrastructure.
Table of Contents
- What Does Provider Revenue Analytics Actually Cover?
- What Are the Core Use Cases for Provider Revenue Analytics?
- Which Dashboards and Queries Matter Most Day to Day?
- How Do You Choose and Implement a Revenue Analytics Solution?
- How HIMShield Puts Revenue Analytics to Work for Independent Practices
- How Do Regulatory Rules Shape Provider Revenue Analytics?
- What Data Privacy and Security Practices Should You Expect?
- What Do Real Benchmarks Show About Provider Revenue Analytics?
- How Are Predictive Analytics and Machine Learning Changing Revenue Optimization?
- Author Perspective: What Actually Moves the Needle First
- Recover Hidden Revenue Without Building an Internal Analytics Team
- Sources
- FAQ
What Does Provider Revenue Analytics Actually Cover?
Provider revenue analytics only works if it can see the full financial path of a claim, from the exam room to the remittance advice. That means pulling data from five places: the EHR (documentation and codes), the practice management system (scheduling and charges), the claims clearinghouse (submission status), payer remittance files (what actually got paid), and denial logs (why a claim bounced). Skip one, and you get a partial picture that misattributes blame to the wrong provider or payer.

The architecture behind this is not glamorous, but it matters. Data gets ingested from each source, normalized into a common format (CPT, ICD-10, HCPCS codes mapped consistently), and then attributed to the rendering provider and billing payer. Without that attribution step, you can see that denials went up. You cannot see that Dr.
Four metrics anchor almost every serious provider revenue analytics setup:
- Net collection rate: the percentage of collectible revenue actually collected, adjusted for contractual write-offs.
- A/R days: how long cash sits uncollected after a claim goes out.
- Denial rate: the share of claims rejected on first submission, broken out by payer and reason code.
- Coding variance: how far a provider's coding distribution drifts from specialty peers or CMS benchmarks.
Each metric points to an action. A rising coding variance for a single provider usually means it's time for a targeted chart review, not a practice-wide policy change. CAQH's index research makes the case that unifying provider and network data, paired with automated verification, is now essential to closing these access and performance gaps at scale.
What Are the Core Use Cases for Provider Revenue Analytics?
Vendor pitches tend to bundle four distinct capabilities under one marketing umbrella. Separating them helps you prioritize the one that fits your practice's actual pain point.
- Charge accuracy and provider coding performance. This is where analytics compares a provider's billed codes against documentation and peer benchmarks to catch undercoding (leaving money on the table) and overcoding (creating audit exposure). Benchmarking against specialty peers and CMS norms, as Intrinsiq's coding pattern analysis demonstrates, reveals outliers and quantifies the financial impact of correcting them before an auditor does it for you.
- Pricing analytics and price transparency readiness. Contract modeling tools let you simulate how a proposed payer rate change affects net revenue across your provider mix, while transparency-rule compliance requires accurate, current chargemaster data that most practices don't maintain well.
- Denials intelligence. Instead of reviewing denials one claim at a time, root-cause analytics groups them by payer, code, and provider to find the pattern behind the noise. Wakefield's research on revenue cycle efficiency points to proactive denial management, not reactive appeals, as the lever that actually moves the needle on collections.
- Provider performance scorecards. Peer benchmarking turns abstract compliance talk into a number every clinician can see: how their coding, documentation completeness, and denial rate compare to colleagues in the same specialty.
Pro Tip: Start with charge accuracy before you build a single dashboard. It's the module with the shortest path from insight to a specific dollar recovered, and it gives your team an early win that builds buy-in for the rest of the rollout.
Provider scorecards deserve special attention because they change behavior, not just visibility. Press Ganey's work on provider and network performance shows that dashboards surfacing compliance risk alongside satisfaction data help organizations catch access and performance problems before they become bigger liabilities. A scorecard that only reports metrics without a coaching conversation attached rarely changes anything.
Which Dashboards and Queries Matter Most Day to Day?
Most revenue cycle teams already have more dashboards than they use. The problem isn't a data shortage. It's that the four dashboards that actually drive decisions get buried under a dozen that don't.
- Denials funnel: shows claims moving from submission to denial to appeal to final resolution, with drop-off rates at each stage.
- Payer lag heatmap: visualizes which payers are slow to pay by claim type, so your team knows where to escalate.
- Provider outlier table: ranks providers by coding variance and denial rate against specialty benchmarks.
- Monthly recovery tracker: totals dollars recaptured from corrected claims and resubmissions.
Behind every dashboard sits a query, and the questions worth asking scale from broad to specific. At the practice level: "What's our net collection rate trending over the last six months?" At the payer level: "Which payer has the highest denial rate for our top five CPT codes?" At the provider level: "Which provider's E/M coding distribution deviates most from CMS benchmarks this quarter?"
| Query level | Example question | What it reveals |
|---|---|---|
| Practice-wide | Six-month net collection rate trend | Overall financial health direction |
| Payer-level | Highest denial rate by payer and code | Where to focus appeals and contract talks |
| Provider-level | Coding variance vs. specialty benchmark | Who needs coaching or chart review |
| Claim-level | Root cause of a specific denial | The exact documentation or code fix needed |
The shift from static spreadsheet exports to conversational, ask-your-data interfaces cuts investigation time from hours to minutes. RevenueVitals demonstrates this directly, letting practices type a plain-English question and get an answer on payer lag or denial causes without anyone building a pivot table first. Manual VLOOKUPs across monthly exports simply can't keep pace with a denial pattern that needs attention this week, not next quarter.
How Do You Choose and Implement a Revenue Analytics Solution?
Vendor demos tend to look impressive and answer different questions than the ones you'll actually ask six months in. A tighter checklist keeps the evaluation honest.
Selection checklist:
- Does it connect natively to your EHR and practice management system, or does someone need to build custom connectors?
- Does it score performance at the individual provider level, not just the practice level?
- Does it generate audit-defense documentation, not just flag problems?
- Is the clinician-facing interface simple enough that a busy physician will actually use it?
- Does it meet HIPAA security requirements with clear data handling agreements?
- Does it produce reporting templates your billing team can act on without a data analyst on staff?
Questions worth asking every vendor before you sign anything:
- How does your platform access our data, and who owns it once it's in your system?
- What's the actual runbook when a coding gap is identified? Does it end in a report, or in a corrected, submitted claim?
- Can you show recovery numbers from a practice our size and specialty?
- Can we talk to a current customer with a similar payer mix?
- What's the realistic timeline from EHR connection to first recovered dollar?
Implementation follows a fairly consistent sequence once you've picked a platform:
- Connect the EHR and practice management system to the analytics platform.
- Run an initial audit, typically 30 days, to surface the highest-value gaps.
- Prioritize the top revenue-leakage items by dollar impact, not alphabetically or by department.
- Train clinicians on the specific documentation or coding change needed, tied to real examples from their own charts.
- Measure outcomes against the metrics you defined at the start.
Success metrics should be set before the audit runs, not after. The three that matter most: dollars recovered against the leakage identified, denial rate reduction over 60 to 90 days, and net collection rate improvement quarter over quarter. If a vendor can't tie their pricing to at least one of these, keep looking.
How HIMShield Puts Revenue Analytics to Work for Independent Practices
Most independent practices don't have a data team, and they shouldn't need one to protect revenue they've already earned. HIMShield identifies coding, documentation, and charge-capture risks before they become denials or audits, which is the exact "catch it before submission" approach that separates fast recovery from slow appeals.
The platform delivers automated risk detection and physician-friendly guidance rather than a raw data dump nobody on staff has time to interpret. That distinction matters for practices where the person reviewing the report might be a billing manager, not a data analyst.
- Connects to your EHR to scan documentation and coding patterns against payer rules.
- Quantifies revenue leakage per provider and per payer, not just at the practice level.
- Auto-drafts corrections with one-click physician e-signature so fixes don't stall in someone's inbox.
- Assembles submission-ready responses if a payer audit does happen.
Practices typically see recovery within 30 days of connecting their EHR, with reported hidden-revenue recovery in the $5,000 to $50,000-plus range depending on provider count and specialty mix. That range reflects the reality that a single-provider primary care practice and a multi-specialty group with a dozen clinicians will surface very different dollar amounts, even when the underlying coding gaps look similar on paper.
The gap between what a practice bills and what it's actually earned rarely shows up until someone looks at the coding pattern provider by provider, payer by payer. That's the layer most billing software never reaches.
For practices researching this space, HIMShield's own breakdown of why practices lose reimbursement walks through the specific documentation gaps that drive the leakage numbers above.
How Do Regulatory Rules Shape Provider Revenue Analytics?
Compliance isn't a side issue in revenue analytics. It's the reason the discipline exists in its current form. Federal price transparency rules require hospitals and, increasingly, practices to publish accurate, current pricing data, and analytics platforms that can't reconcile chargemaster data with actual billed amounts leave a compliance gap alongside a financial one.
Coding compliance carries its own weight. The Office of Inspector General and CMS both use claims-pattern analysis to flag outlier providers for audit, which means the same coding variance metric that helps you find lost revenue is also the metric an auditor uses to find you. Analytics that surface a coding gap and generate audit-ready documentation in the same motion turn a compliance risk into a controlled correction instead of a scramble after a payer letter arrives.
Value-based care contracts add another layer. Many now tie a portion of reimbursement to quality metrics and documented risk-adjustment accuracy, particularly HCC coding for Medicare Advantage populations. Getting that documentation wrong doesn't just risk a denial; it risks a clawback months later once the payer reconciles risk scores. Analytics platforms that flag documentation gaps in real time, before submission, give practices a chance to correct course while the chart is still open rather than after a retrospective audit finds the pattern.
Regulatory exposure, in other words, runs in both directions: analytics that ignore compliance context optimize for revenue today at the cost of audit risk tomorrow.
What Data Privacy and Security Practices Should You Expect?
Revenue data is patient data by extension. Every claim record ties a diagnosis code, a procedure, and a payment amount to a specific patient, which means a revenue analytics platform is handling protected health information under HIPAA even though its primary function is financial, not clinical.
That has practical implications for what you should demand from any vendor. A signed Business Associate Agreement is non-negotiable, spelling out exactly how the vendor may use, store, and dispose of your data. Encryption in transit and at rest should be standard, not a premium tier. Access controls matter just as much internally: role-based permissions should limit which staff can see full patient-level detail versus aggregated provider metrics.
Data minimization is worth asking about directly. Some platforms pull and retain far more patient detail than the analytics actually require, which expands your breach exposure without adding value. A platform that can quantify coding variance and denial root cause without warehousing unnecessary clinical detail reduces the surface area of what could go wrong.
Ask vendors where the data physically resides, whether it is used to train models across other clients' data (and whether that's disclosed), and what happens to your data if you cancel the subscription. Independent practices, unlike hospital systems, often lack a dedicated compliance officer to catch a weak answer to any of those questions, which makes asking them upfront more important, not less.
What Do Real Benchmarks Show About Provider Revenue Analytics?
Numbers travel further than promises in this space, and the available benchmarks tell a consistent story: analytics-first practices recover money two ways, not one. They catch underbilled revenue that would otherwise go uncollected, and they avoid the overpayments and audit exposure that come from documentation gaps and coding drift. Wakefield's analysis frames this as a dual benefit of proactive analytics: cleaner claims going out, and fewer costly corrections coming back.
Provider-level benchmarking, specifically comparing a provider's coding distribution against specialty peers and CMS national data, has become the standard way organizations decide which providers to audit or coach first, according to Intrinsiq's coding pattern research. That prioritization step matters more than it sounds. A practice with six providers and limited billing staff time can't review every chart. Benchmarking tells them which one or two providers account for most of the risk and most of the recoverable revenue.
MedInsight's work on provider performance tracking adds a value-based care angle: organizations that measure provider variation in real time and share it directly with clinicians see faster behavior change than those that report metrics only at year-end review. The lesson across these findings is the same one independent revenue leakage examples tend to confirm: specific dollar-impact scenarios usually trace back to one or two identifiable coding or documentation patterns, not a dozen scattered problems.
How Are Predictive Analytics and Machine Learning Changing Revenue Optimization?
Rule-based analytics catches what already happened. Predictive models try to catch it before the claim ever leaves the building, and that shift is where the next wave of recoverable revenue sits.
Machine learning models trained on historical denial data can flag a claim likely to be denied before submission, based on the combination of payer, code, modifier, and documentation completeness that has predicted denials in the past. That's a meaningfully different workflow than reviewing a denial after the fact. It moves the correction upstream to the point where a fix takes a clinician thirty seconds instead of triggering a full appeals process weeks later.
Natural language processing applied to clinical documentation can flag when a note doesn't support the code being billed, essentially running a real-time coding audit at the point of documentation rather than a retrospective one. This is the layer that turns "we found the problem" into "the problem never became a claim."
Predictive models also help with prioritization at the portfolio level. Instead of reviewing every provider's coding pattern with equal attention, a model can rank providers by predicted audit risk or predicted revenue impact, so limited compliance staff time goes to the highest-value review first. None of this replaces human judgment on a complex chart. It does mean the humans reviewing charts spend their time on the cases where a model has already flagged real risk, not on random sampling.
Author Perspective: What Actually Moves the Needle First
If you're deploying revenue analytics for the first time, resist the urge to build every dashboard before you fix anything. Provider coding and charge-capture checks deliver the fastest, most measurable ROI, because they catch dollars before a claim ever leaves the building rather than chasing them after a denial.
Analytics without a remediation workflow is just an expensive report nobody acts on. Pair every dashboard with a clear next step: who reviews the flag, who talks to the provider, who resubmits the claim. I've seen more revenue cycle initiatives stall from over-instrumentation than from under-analysis. A practice with three working dashboards and a clear escalation path will outperform one with fifteen dashboards and no owner for any of them.
— Elena
Recover Hidden Revenue Without Building an Internal Analytics Team
HIMShield is the alternative to hiring a data analyst or building custom reporting from scratch. It's a platform built specifically for independent physician practices that identifies coding, documentation, and charge-capture gaps in your EHR data before they turn into denials or audits.
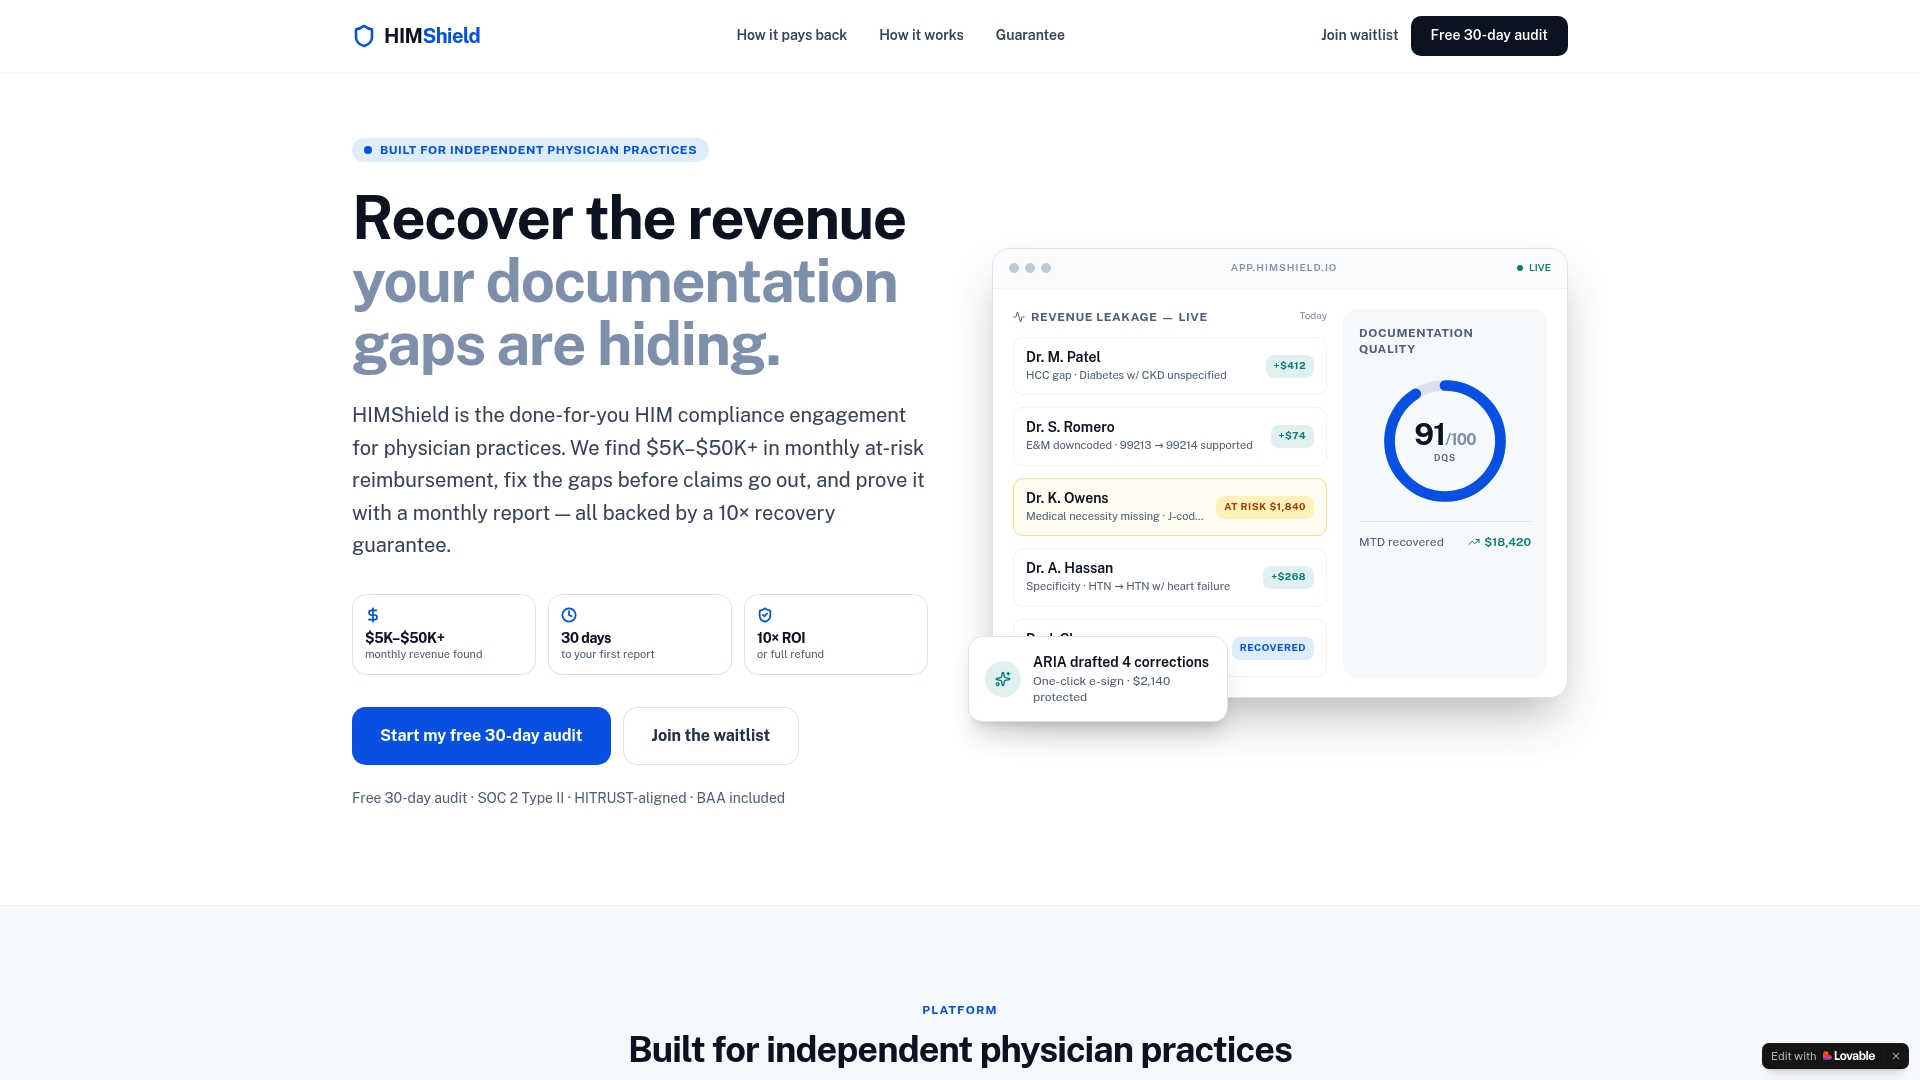
If your practice has neither the staff nor the time to build the dashboards, benchmarking, and query tools described throughout this guide, HIMShield does that work for you. The platform connects directly to your EHR, runs a free 30-day audit, and delivers a Revenue Leakage Report showing exactly what's recoverable, provider by provider and payer by payer. Corrections come with one-click physician e-signature, so fixes move fast instead of sitting in a queue. Practices considering whether to build internal tooling or bring in a specialized platform should weigh the time-to-value: HIMShield's audit path typically surfaces recoverable revenue within 30 days, well before most in-house analytics builds would even finish data integration. Start with the free 30-day audit at HIMShield to see what's currently going unrecovered in your own claims data.
This article is general information, not a substitute for advice from a qualified doctor. Consult a qualified healthcare professional about your own circumstances before acting on anything here.
Sources
- CAQH Explorations: CAQH Index Report
- Provider and network performance | Press Ganey
- Data Analytics in Revenue Cycle Efficiency - Wakefield
- Bringing data-driven clarity to provider coding patterns
- RevenueVitals
FAQ
What Does Revenue Analytics Do?
Revenue analytics turns raw EHR, claims, and remittance data into per-provider, per-payer insight, showing where charges are undercoded, where denials cluster, and where net collections are slipping. Platforms like HIMShield apply this specifically to independent practices to flag risks before claims submission rather than after a denial arrives.
How Is RCM Different From Medical Billing?
Medical billing is the transactional process of submitting and following up on individual claims. Revenue cycle management (RCM) is the broader system, including analytics, denial management, and provider performance tracking, that governs how well the whole billing process performs over time.
What Metrics Should a Provider Revenue Analytics Dashboard Track?
The core metrics are net collection rate, A/R days, denial rate, and coding variance, each broken out by provider and payer. These four numbers, tracked together, reveal both what's being lost and which provider or payer relationship is driving the loss.
Is Medical Revenue Service a Debt Collector?
No. A provider revenue analytics or revenue cycle service identifies and corrects billing, coding, and documentation issues before or shortly after claim submission. That's a fundamentally different function from debt collection, which pursues unpaid patient balances after the billing cycle is already closed.
How Long Does It Take to See Results From Revenue Analytics?
Most practices using a platform like HIMShield see initial recovery findings within 30 days of connecting their EHR, since the first audit is designed to surface the highest-value gaps quickly rather than wait for a full quarterly cycle.