
The Healthcare Financial Management Association's MAP Keys define clean claim rate as the share of claims that pass every edit and reach the payer with no manual intervention, calculated as (claims passing all edits ÷ total claims submitted) × 100. HFMA sets the standard target at 95%, with 98% marking high-performance revenue cycle operations.
TL;DR:
- Achieving a clean claim rate above 95% requires strict, manual-free submission, with high performers targeting 98% or more through payer-specific scrubbing.
- Many clearinghouses report acceptance rates that overstate true clean claims, leading practices to underestimate manual intervention and quality issues.
- Common causes of claim rejection include eligibility failures, missing prior authorizations, coding errors, and demographic mistakes, each costing an average of $118 per correction.
- A significant gap between clean claim rate and first-pass resolution rate indicates payer-side denials that require targeted auditing and process improvement.
- Automated tools that identify pre-submission coding and documentation gaps can recover thousands of dollars in revenue and reduce manual touches before claims reach payers.
Table of Contents
- What Clean Claim Rate Actually Measures
- How to Calculate Clean Claim Rate Step by Step
- Where Your Number Should Land
- Why Claims Get Rejected Before They Ever Reach a Payer
- Clean Claim Rate vs. First-Pass Resolution Rate
- Auditing Your Numbers So They Don't Lie to You
- How Automated Detection Reduces Manual Touches Before Submission
- What Most Audits Actually Reveal
- Recover Revenue Himshield Finds Before It Becomes a Denial
- Sources
What Clean Claim Rate Actually Measures
HFMA's definition is stricter than most practices assume. A claim only counts as "clean" if it moves through your system without a single manual touch. No hold, no correction, no staff review, no resubmission. If a biller opens the claim to fix a typo before it goes out, that claim fails the clean test even though it eventually gets paid.
The denominator matters just as much. Voided and canceled claims get excluded, since they never represented a real submission attempt. What stays in the count is every claim your practice actually tried to send.
Here's where reporting gets misleading: many clearinghouses report acceptance rates, not HFMA-style clean claim rates. A clearinghouse might mark a claim "accepted" simply because it passed basic formatting checks, even if your staff manually corrected a diagnosis code an hour earlier. That claim is clearinghouse clean but not HFMA clean, and the gap between those two numbers is exactly where practices lose visibility into their real front-end performance.
How to Calculate Clean Claim Rate Step by Step
The formula itself is simple: divide claims that passed all edits with zero manual intervention by the total claims submitted, then multiply by 100. Running that calculation accurately takes more discipline than the math suggests.
- Pick your reporting window. Thirty days gives you a workable trend without too much noise from seasonal claim volume.
- Strip out voids and cancellations before you count anything, since they were never real submissions.
- Flag every claim that required a manual touch, including holds, corrections, and staff-initiated resubmissions.
- Count only claims that moved straight through as your clean claim numerator.
- Watch for split or consolidated claims in your practice management system export, since a single encounter that generates multiple claim lines can quietly distort your denominator.
Where Your Number Should Land
A 95% clean claim rate is the floor HFMA sets for a healthy revenue cycle. High-performing practices push past that to 98%, and organizations running active, payer-specific claim scrubbing report clean claim rates roughly four percentage points higher than practices relying on manual review alone.
That's a different problem, and it calls for a different fix.
- 95% or above: you're at standard performance; focus on incremental payer-specific tuning.
- Below 95%: something in your front-end workflow is breaking repeatedly, not occasionally.
- Below 90%: eligibility verification, prior authorization tracking, or coding logic likely has a structural gap, not a one-off error.
Why Claims Get Rejected Before They Ever Reach a Payer
Demographic and technical errors cause the majority of denials practices deal with, at 61%, and reworking each one costs an average of $118. That's not a rounding error. A practice submitting a few hundred claims a month with a shaky clean claim rate can be bleeding thousands of dollars in labor alone before a single appeal letter gets written.
Pro Tip: Track your rework cost per denied claim for one month. Multiply it by your monthly denial volume, and you'll have a concrete number to justify budget for front-end fixes.
The four causes that show up again and again:
- Eligibility failures — coverage lapsed, plan changed, or the wrong payer was billed.
- Missing prior authorizations — the visit happened before approval was confirmed.
- Coding and modifier errors — mismatched codes, missing modifiers, or outdated crosswalks.
- Demographic and technical mistakes — wrong date of birth, transposed member ID, incomplete address fields.
The fix sequence matters more than most practices realize. Real-time eligibility verification at scheduling and check-in typically produces a 2 to 3 point lift within 30 days. Front-desk re-verification steps, done consistently rather than occasionally, are what make the eligibility gains stick instead of eroding after a few weeks.
Practices exploring dedicated claim scrubbing tools often see the fastest improvement when scrubbing rules are configured per payer rather than applied generically, since each payer enforces its own edit logic.

Clean Claim Rate vs. First-Pass Resolution Rate
These two metrics get confused constantly, and the confusion costs practices real diagnostic time. Clean claim rate measures whether a claim reached the payer clean, before adjudication happens. First-pass resolution rate (FPRR) measures whether that claim actually got paid on the first submission, after the payer reviews it.
- CCR benchmark: 95% or higher, measured pre-submission.
- FPRR benchmark: roughly 90% or higher, measured post-adjudication.
- A high CCR paired with a low FPRR usually signals payer-side friction: medical necessity denials, coverage disputes, or authorization issues the payer catches that your scrubber never could.
- A low CCR points you back to your own workflow, before the claim ever leaves your building.
Picture a practice running a 96% CCR but only an 85% FPRR. The front end looks healthy. The gap says the payer is rejecting claims for reasons your pre-submission checks can't catch, which means the next move is a denial-reason audit, not another round of scrubbing rule updates.
Auditing Your Numbers So They Don't Lie to You
Clearinghouse-reported clean claim rates commonly run 2 to 7 percentage points higher than an HFMA-style audited count, because clearinghouses often measure formatting acceptance rather than true no-touch submission.
- Run a monthly sample trace from your practice management system through the clearinghouse and into payer adjudication logs.
- Query for manual edit flags, holds, resubmissions, and voids specifically, not just final claim status.
- Compare cohorts month over month rather than relying on a single snapshot.
- Pair CCR with FPRR and a denial-reason breakdown so you know whether to fix your own coding audit process or push back on a payer.
How Automated Detection Reduces Manual Touches Before Submission
Every manual touch disqualifies a claim from HFMA's clean count, which means the real lever for improving clean claim rate is catching coding, documentation, and charge-capture gaps before a biller ever has to intervene. Himshield's platform scans EHR data against payer-specific logic to flag those gaps before submission, not after denial.
- Automated risk detection surfaces coding and documentation issues per provider and per payer, so fixes target the actual source of manual edits.
- One-click physician e-signature on drafted corrections keeps the fix from becoming a new manual bottleneck.
- Practices working with Himshield have recovered $5,000 to $50,000 or more in previously leaking revenue, with measurable gains inside a 30-day window in several cases.
- Per-provider, per-payer Revenue Leakage Reports let administrators see exactly which claims would have required manual touches and why.
What Most Audits Actually Reveal
Eligibility gaps and missing prior authorizations show up in nearly every clean claim rate audit we've examined, more often than coding errors get blamed for. The sequence that works: fix eligibility first, layer in payer-specific scrubbing, then build prior authorization tracking on top. Skipping straight to coding fixes without governance around measurement just produces a number you can't trust.
— Elena
Recover Revenue Himshield Finds Before It Becomes a Denial
Most clean claim rate problems trace back to gaps a biller catches too late, after the claim already needed a manual touch. Himshield finds those gaps in your EHR data before submission, so fewer claims need intervention in the first place.
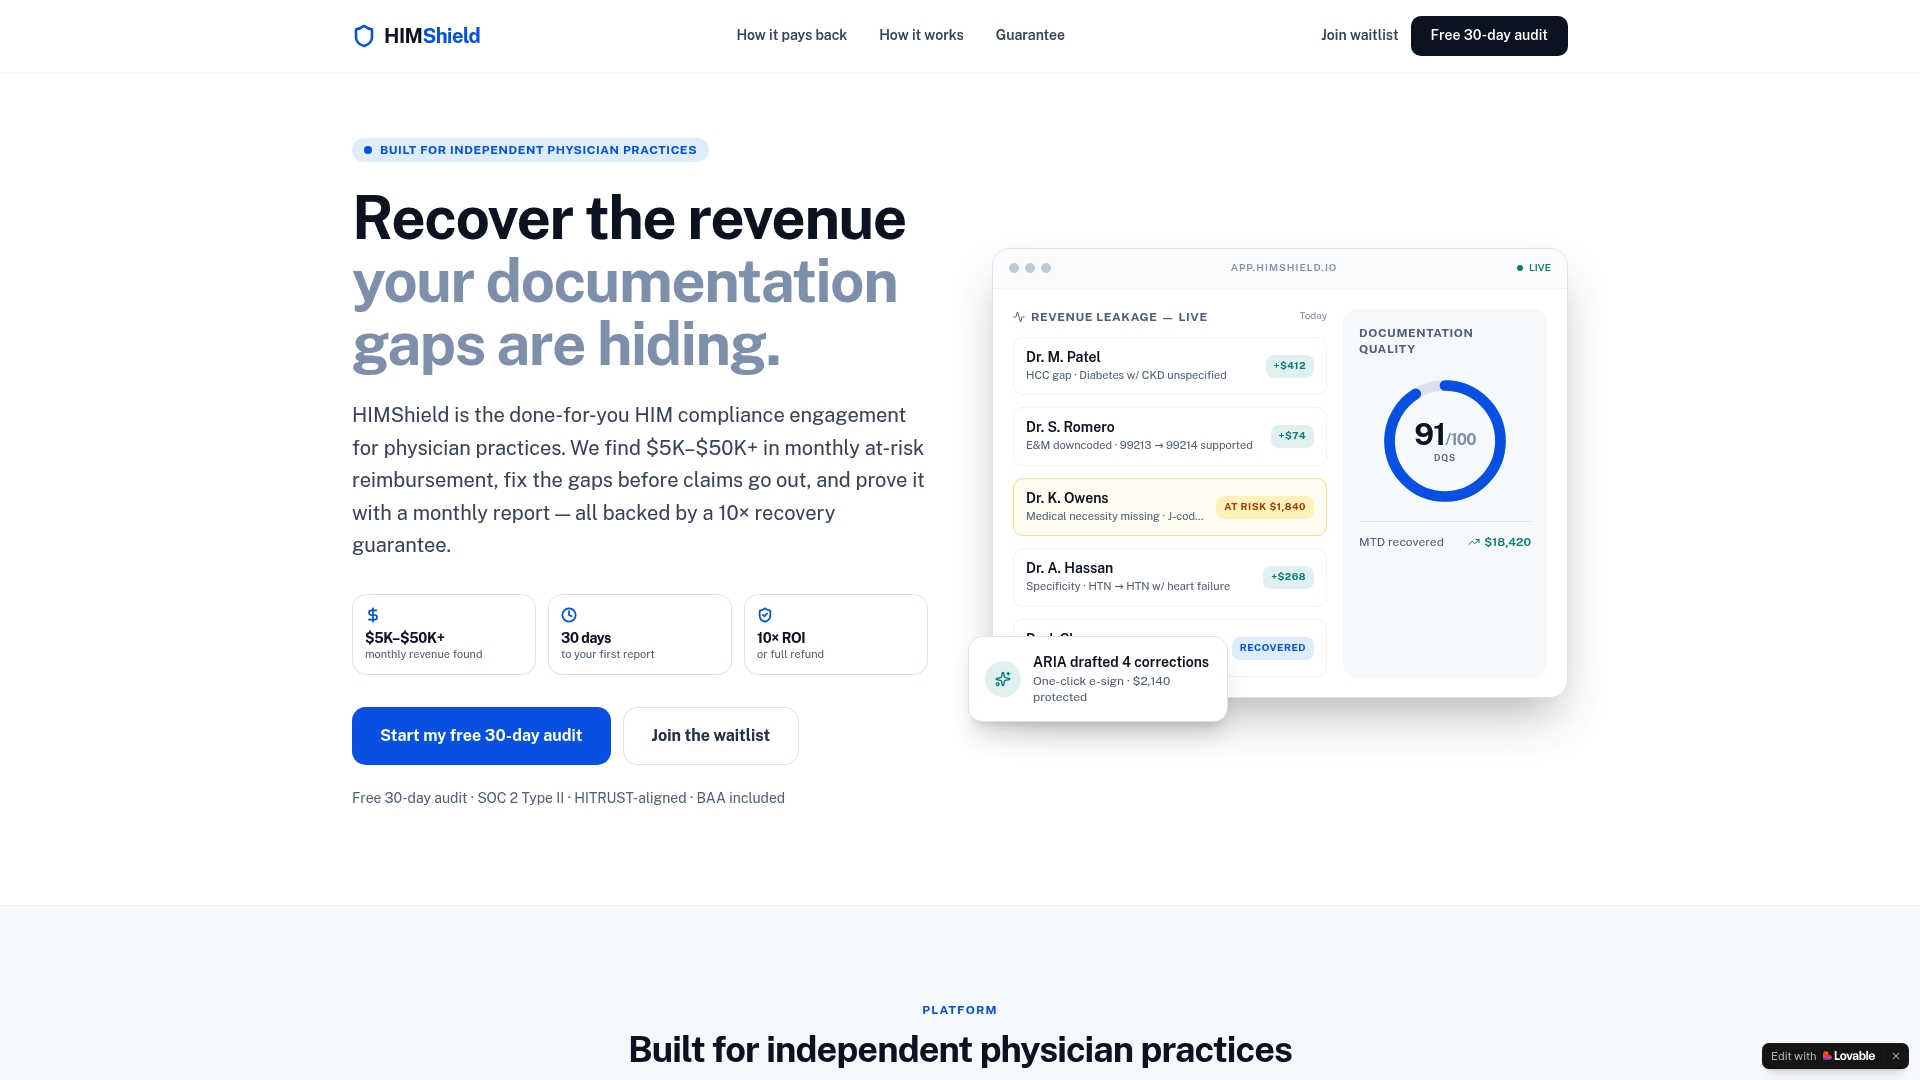
The platform delivers automated compliance alerts, real-time documentation quality scoring, and per-provider Revenue Leakage Reports that show administrators exactly where coding and charge-capture gaps are costing reimbursement. If a payer audit does land, Himshield assembles submission-ready responses instead of leaving your team scrambling. A free 30-day audit comes with a performance guarantee, so you see your actual leakage number before committing to a subscription. Start your free audit at Himshield and find out what your true clean claim rate looks like once the manual touches are gone.
Sources
- HFMA MAP Keys — revenue cycle KPI definitions
- AI in revenue cycle management (University of Colorado business staff report)
- Clean claim rate formula & benchmark (MedPrecision)